
Abstract
Artificial Neural Network (ANN) has been used by the petroleum industry to identify key well performance drivers since the 1990’s. A production and completion databases compiled in Permian (Wolfcamp B) basin was analyzed in this work. In order to leverage neural networks as a computation tool, a detailed pre-processing workflow is recommended which improves understanding of the impact of geology, reservoir, and completion parameters on well production. The paper emphasizes the importance of data normalization, feature selection, and outlier detection as well as their implications on prediction accuracy. Self-organizing maps are used as a multi-dimensional scaling tool for unsupervised learning to preserve topography of the dataset.
Results demonstrate that using a large Permian dataset (~2,300 wells), the ANN model explains 71% of the variance in production and does not overfit when the analysis accounts for feature selection and influential points. The paper also presents key well performance indicators that can be used for a quick evaluation to determine the most economical completion methods. Economic optimization performed by using an assumed cost model indicated large treatment size volumes of about 3,050 lb/ft for the Permian basin.
Workflow
In this paper, a systematic machine learning workflow is followed which begins with data gathering and concludes with model prediction. The workflow includes key steps related to feature selection, overfitting issues and selection of right accuracy metric for the analysis.
Step 1. Dataset Description – Identify the different data sources and combine them into a single database. Permian dataset had 2,293 Wolfcamp B horizontal wells with 66 completion and reservoir attributes.
Step 2. Data Pre-processing and Exploratory Data Analysis – Refine database by cleaning, delete/impute missing or incomplete data, identify and remove influential points and feature selection
Step 3. Model Tuning – Selection of best possible model based on accuracy metrics, along with tuned parameters for the training dataset
Step 4. Validation – Analyze the output of the model using cross-validation. If satisfactory results are not obtained and further tuning is required, repeat step 3. Once the results seem convincing, use the same parameters for the next step.
Step 5. Prediction and Economic Optimization of Cost per Barrel of Oil (USD/BO) – Use the final model to predict 365-day cumulative oil production and in combination with a cost model, optimize well completion parameters based on cost per barrel of oil.
Some highlights and results from the paper are shown below.
Feature Selection: Selection of number of features is based on Recursive Feature Elimination (RFE) and other statistical measures. Another method known as Boruta algorithm is implemented, which is based on Random Forest principle to estimate feature importance using Z-score. It is critical to avoid overfitting and the paper demonstrated that is not the right metric. In this work, cross validated RMSE is used. Figure 1 shows the problem caused due to overfitting, along with the comparison of multiple models.
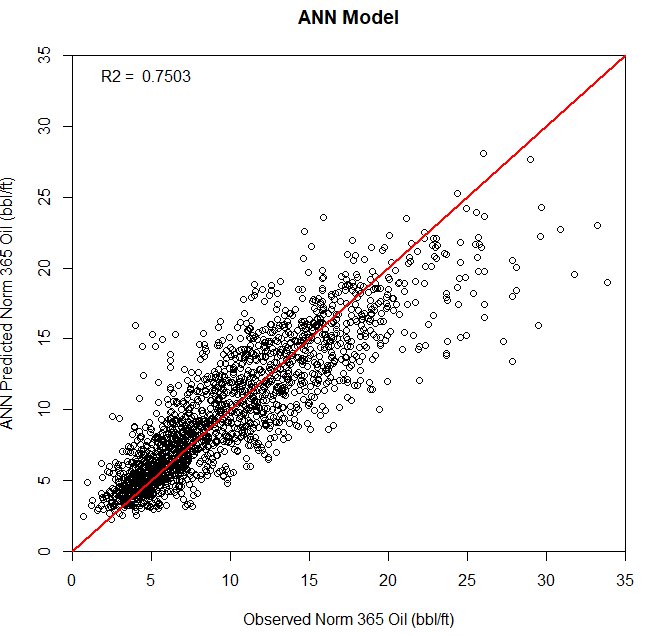
Figure 1. An example of ‘overfitting’ for a more complicated neural network with more hidden layers and neurons, achieving higher but a lower prediction accuracy (left) and overfit neural network performance comparison with other models (right)
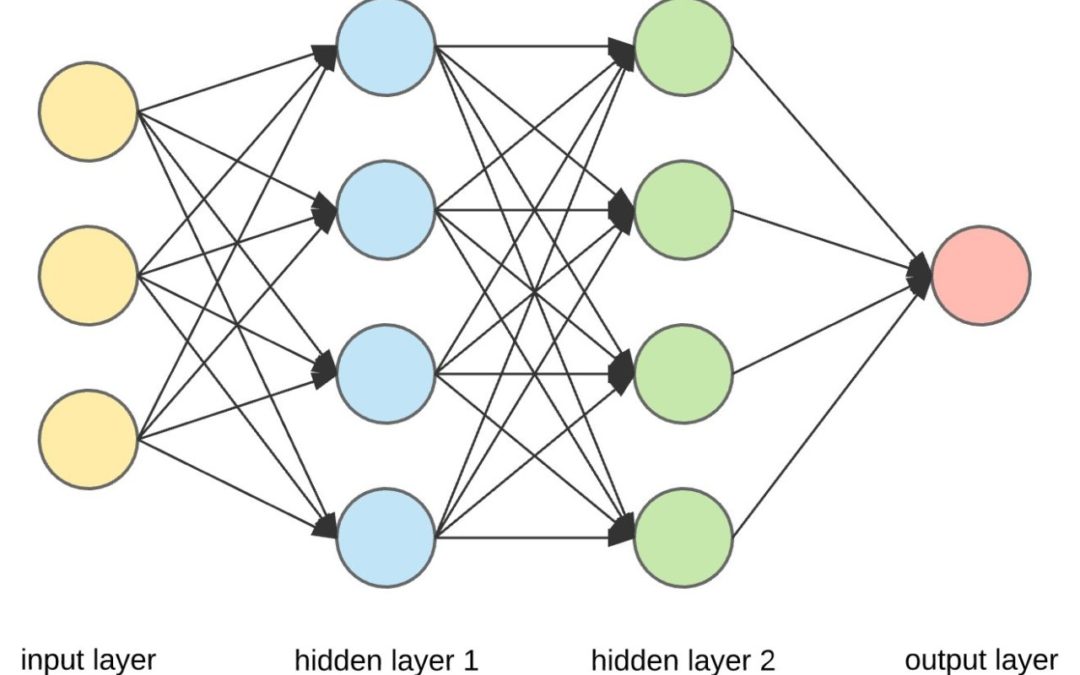
Model Results: ANN architecture included a single hidden layer with 10 neurons along with Normalized production per foot of lateral (bbl/ft) as the response variable and the results are shown in Figure 2.

Figure 2. Neural network model results (left) and hyper-parameter tuning for decay (right)
Comparison with ACE augmented physics based model: A comparison of ANN to ACE augmented physics-based model (Lolon et al. 2018) using proppant mass as a variable, is shown below in Figure 3. The results indicate an increase in incremental oil from 1,000 to 2,000 lb/ft.
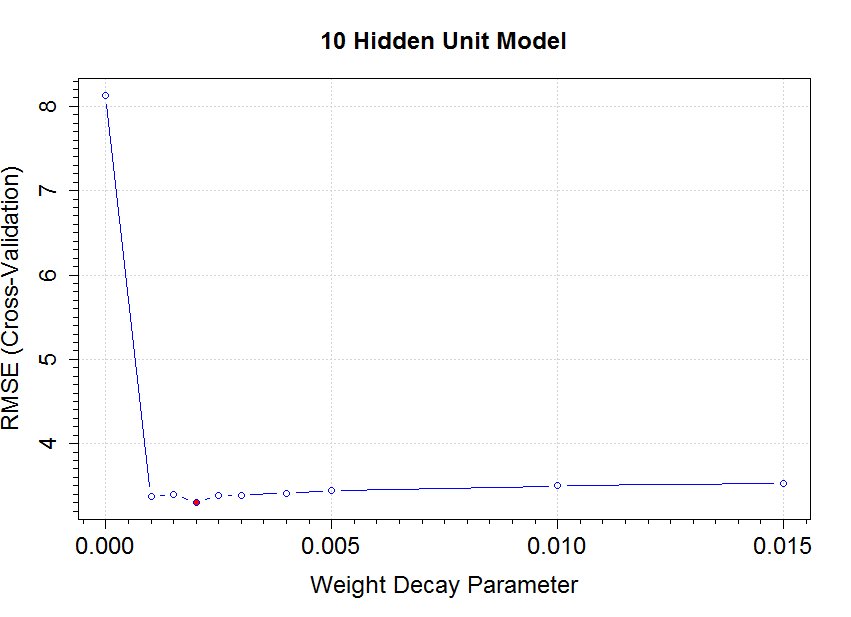
Figure 3. Comparison of ANN with ACE augmented Physics based model
Model Predictions: Using the sensitivity analysis approach by analyzing one variable at a time and keeping the others constant at their mean values, predictions were made using ANN algorithm. The results are shown below in Figure 4.
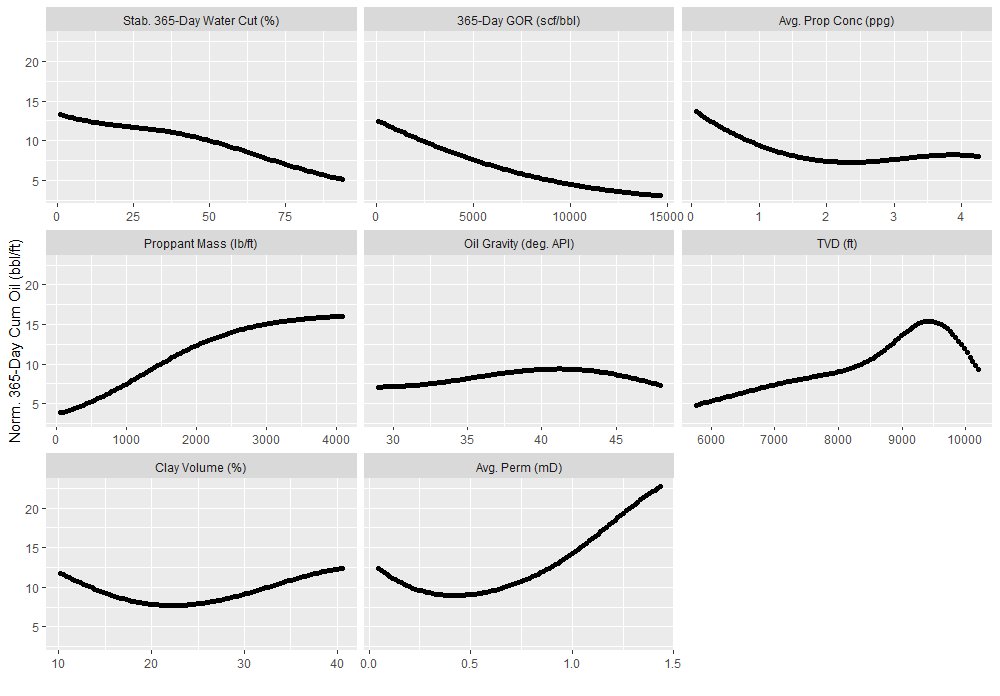
Figure 4. Sensitivity analysis of each predictor with the response variable Norm 365-Day cumulative Oil (bbl/ft), calculated using Neural Network
Application of SOM: Self-Organizing Maps are used as an exploratory data analysis tool to generate qualitative correlations. This is a neural network based unsupervised learning method which uses the concept of competitive learning, in comparison to ANN (which used backpropagation with gradient descent). The algorithm provides a 2D discretized representation of variables in the form of clusters and hence could also be used for dimensionality reduction. Application of SOM for Permian dataset is shown in the Figure 5.
To build the perceptual maps, an iterative approach was followed to define the type of factors and the total number of them. The first attempt for the number of factors was two, considering the results of the clustering process. The optimum “Ward analysis” resulted in three factors for the perceptual maps: Power, Comfort/Maneuverability, and Muscle. Each of the defining variables for each factor are shown on the Table 2.
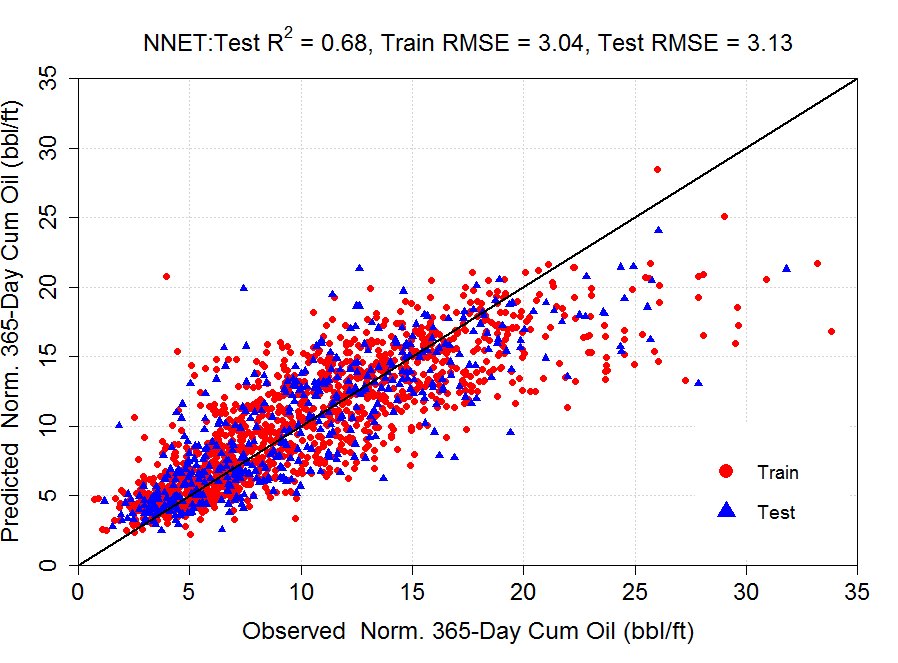
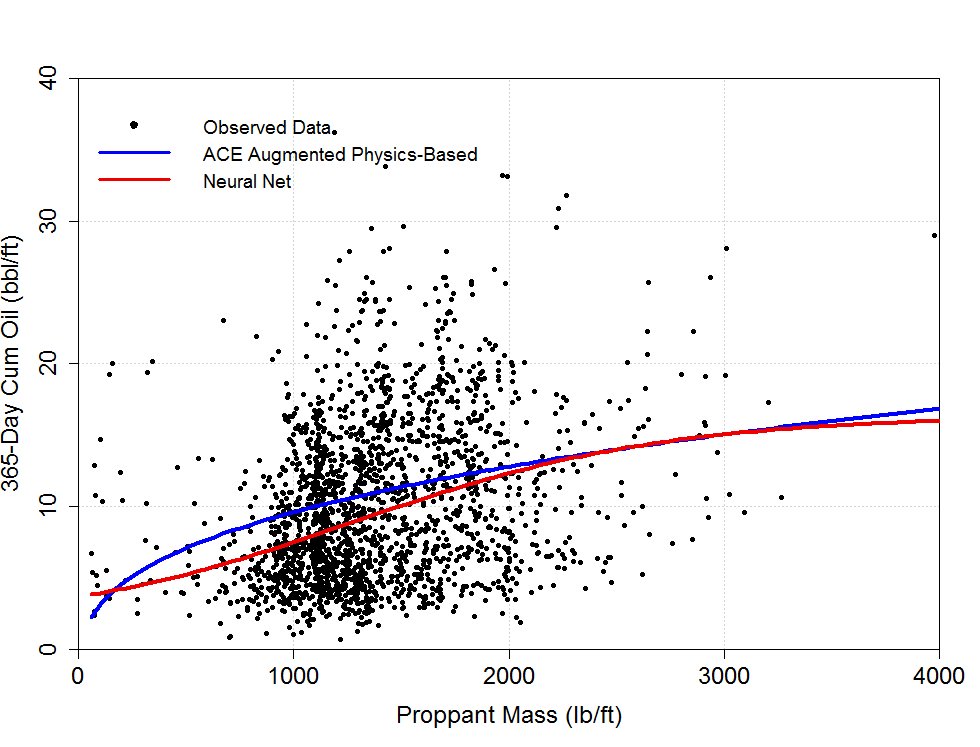
Figure 5. Results for Self-Organizing Maps for the Permian dataset. The color scale varies from blue (low) to red (high)
Conclusions:
- Data-driven ANN shows better performance for comprehensive dataset
- Exploratory data analysis and model tuning is critical to build a robust predictive model
- A complex algorithm/model is not always the right answer and not correlated to accuracy
- Non-uniqueness of different statistical methods observed between ANN and ACE augmented physics-based model
- ANN model points to a larger optimum treatment size of 3,050 lb/ft in Midland basin
The project is a part of study conducted by Ayush Rastogi along with the technology team at Liberty Oilfield Services, Denver CO. The paper was presented at SPE/AAPG/SEG Unconventional Resources Technology Conference in July, 2019.
Document ID: URTEC-2019-247-MS
Link: https://doi.org/10.105530/urtec-2019-247
For any questions or comments, please refer to the paper for more details. Ayush can be reached out at ayushrastogi@mines.edu.
Ayush Rastogi
PhD Candidate, Colorado School of Mines
Ayush is a Ph.D. Candidate in the Petroleum Engineering Department at Colorado School of Mines. His research is based on mechanistic modeling for multi-phase fluid flow and integrating physics-based and data-driven algorithms to develop robust predictive models. He holds a minor in Computer Science with a focus on Data Analytics and Statistical Modeling. He has worked with Liberty Oilfield Services as an Intern in Technology Team in Denver, prior to which he worked as a Field Engineer Intern in TX, ND, and CO. He also has experience working as a Petroleum Engineering Consultant in Houston, TX. Ayush holds a BS and MS in Petroleum Engineering and is an active member of SPE.
Recent Comments