
Created by Hoang Tran
The complete work of this project was published on Nature.com. For more information, please visit here
Hoang Tran is also leading a project of “Flood Monitoring through Satellite Images” within our association. If you have any questions regarding his work or if you are interested in joining his project, feel free to email him.
Motivation
Satellites provide direct observations of vegetation, water and snow. For a snow-driven state like Colorado, snow images from satellite play an important part in water resources monitoring. However, during snow accumulation seasons, clouds which gather to form snow, also block satellite from capturing a dynamic of snow extents.
The objective of my work is to reproduce satellite images with accurate snow area representation with the consideration of clouds.
Methodology
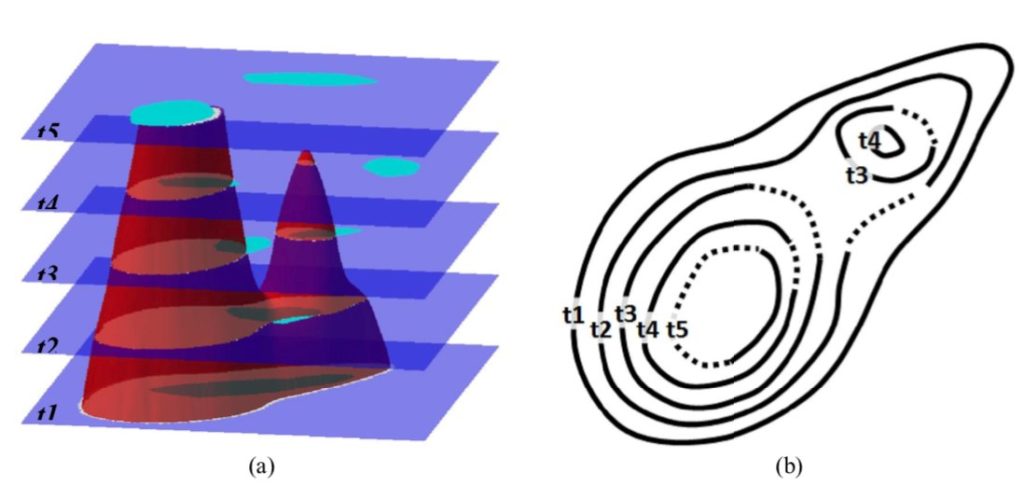
In order to recover polluted images by clouds, I adapted an interpolation method from the image processing field. The method, named as Variational Interpolation (VI), employs all available information of the snow boundaries in time and space to construct a 3D implicit surface of the snow.
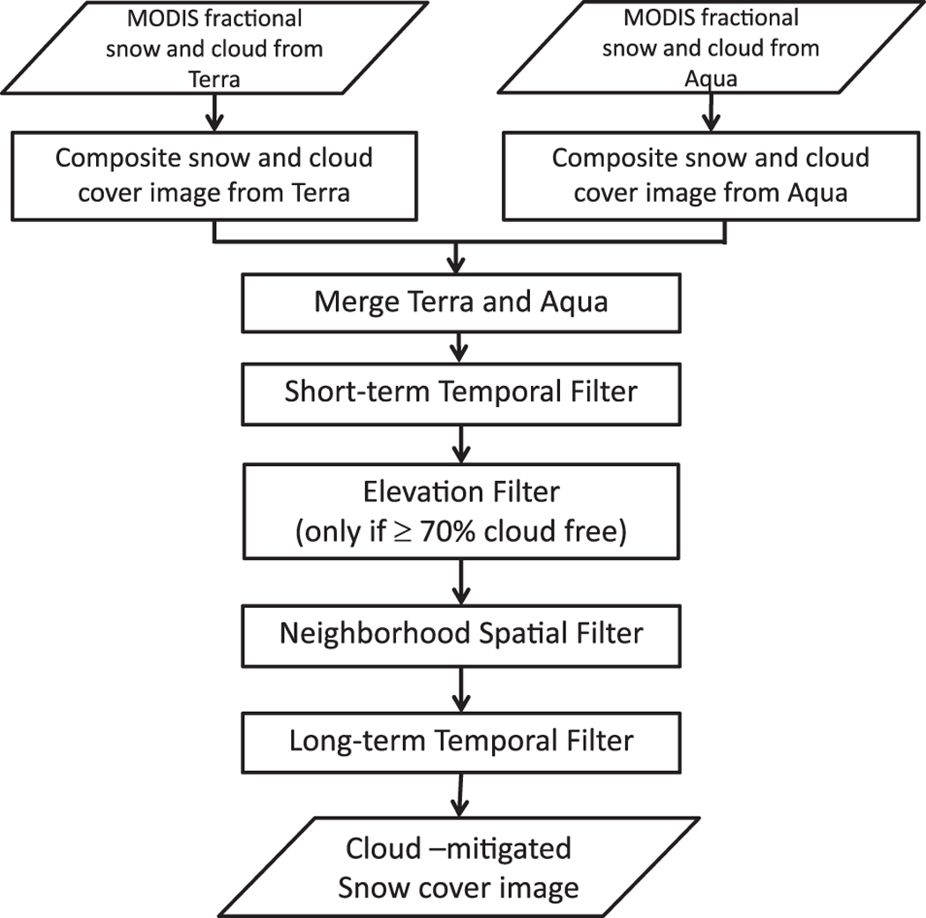
Figure 1 illustrates the flow of cloud polluted images through the filters and the functions applied by the filters. The importance of using the filters is that they provide the necessary information about snow boundaries in order for the VI algorithm to be applied.
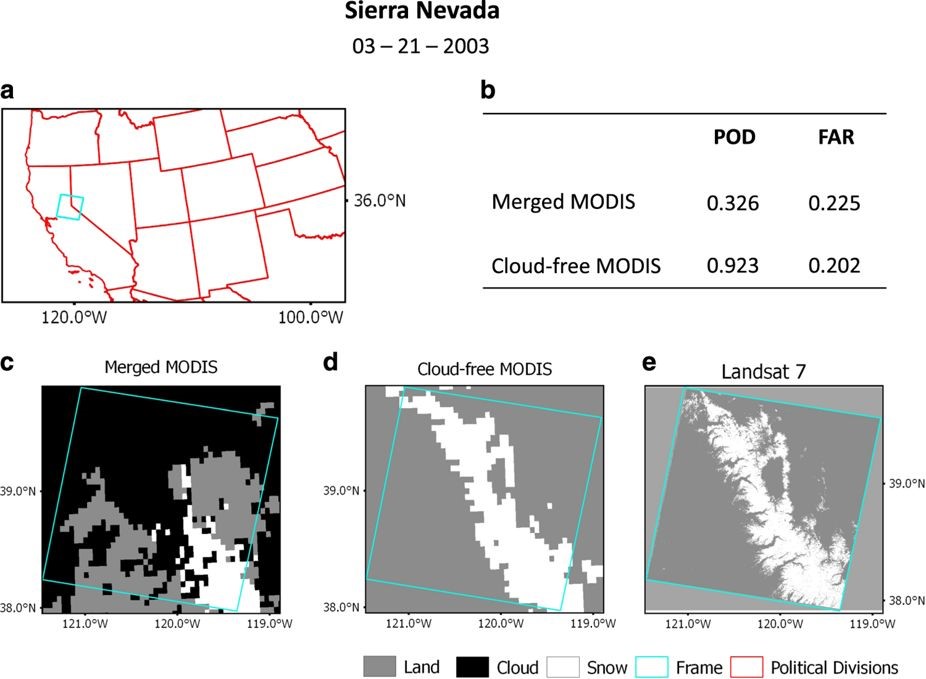
Implicit functions, which can represent very complicated surfaces, are used to solve for the weight of each available boundary point collected. Once the 3D surface of snow is constructed (Figure 2), snow images from interval time steps can be sliced from the surface. Figure 3 shows a validation example over the Sierra Nevada region that my method works well.
Results and Values
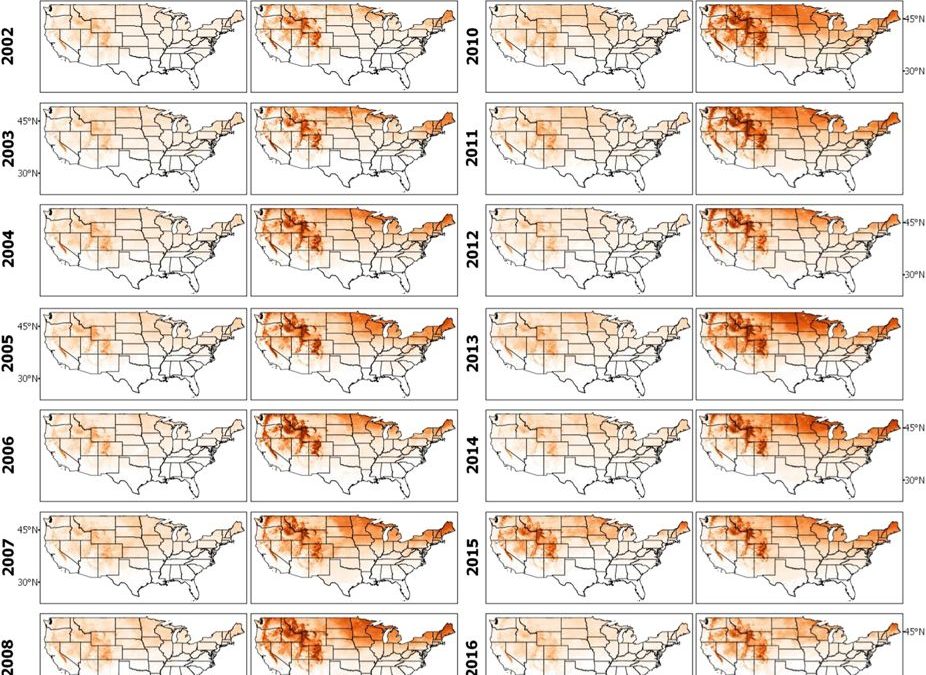
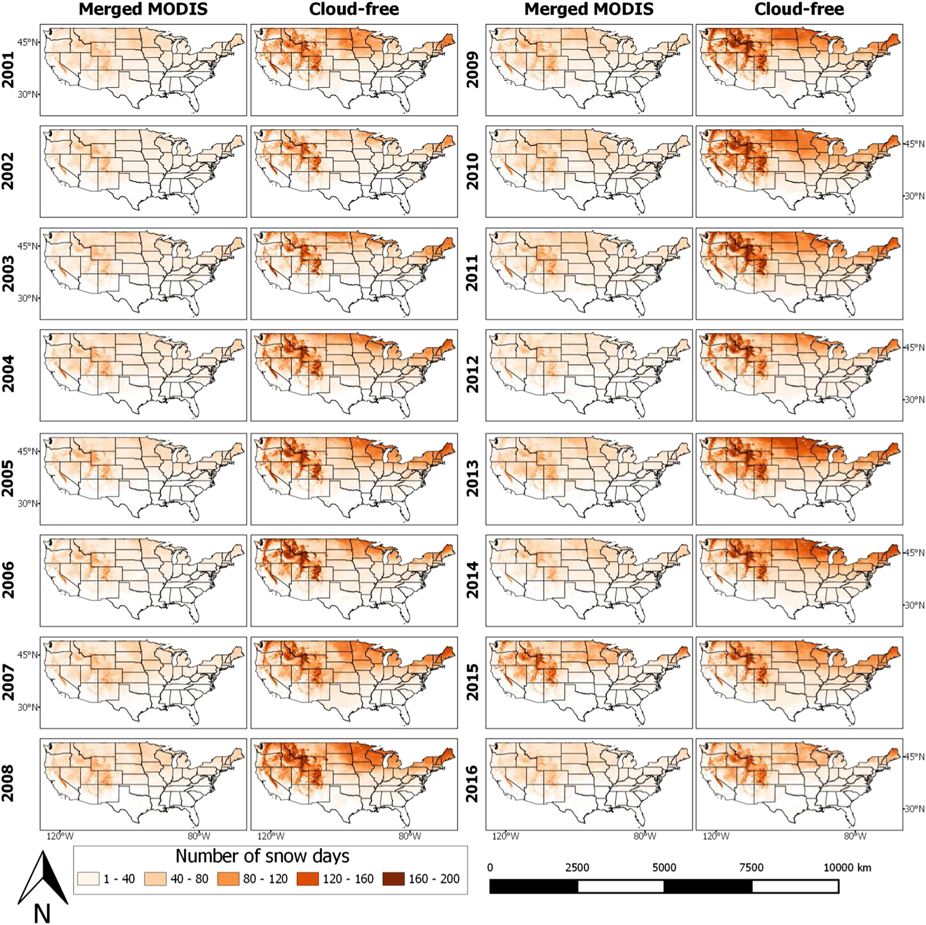
I used the VI algorithm to recover an established snow image dataset from NASA, the MODIS-SCA dataset. The resulting cloud-free snow images are available from 2000 to 2017 for the whole contiguous US. After a rigorous evaluation with snow gauges and airborne observers, the dataset shows high accuracy and therefore will be a reliable and valuable source of snow information for various stakeholders (Figure 4).
The cloud-free dataset provides considerably different and more accurate estimates regarding both the amount of snow as well as the number of snowy days. This has considerable implications in the results of hydrologic and climate modeling studies.
Hoang Tran
Postdoctoral Researcher
Hydrology
A passionate and pro-active hydrologist and (geo) data scientist. Strong background in hydrologic modeling and remote sensing hydrologic variables. Strong analytical and quantitative skills. Experience working with complex database (MySQL/PostgreSQL). Interests: CAT (Catastrophe) Modelling and Quantitative Analysis in Re/Insurance Industries; Hydrology and Hydrometeorology; Hydrological Modeling; Remote Sensing, Satellite Imagery, and Applications; Probability, Statistics and Statistical Modelling; Big Data, Machine Learning, Deep Learning
Recent Comments