

Abstract
This paper considers whether the reform of North Dakota’s natural gas flaring policy provided large operators a competitive advantage, leading to increased market concentration. North Dakota was the highest gas flaring and venting state in USA until it was taken over by Texas in 2015 coinciding with the implementation of its gas flaring policy in 2014. Two analyses are performed in North Dakota (and Wyoming, as a control) to compare the effect that the flaring policy had on the state’s oil sector. The analyses show mixed evidence, larger firms gained an advantage leading to fewer smaller firms operating in the state. The paper concludes with highlighting possible further areas for research, and methodologies for acquiring more reliable data.
Introduction
In this paper three type of analysis were performed based on the dataset obtained from DrillingInfo on operators in North Dakota and Wyoming. The analysis helped us in verifying the hypothesis of market getting concentrated in the state (ND) where the gas flaring policy was implemented compared to the state (WY) where it was not. The following methods with their results are shown below.
Methodology
Herfindahl – Hirschman index calculation
The first analysis is to calculate a Herfindahl-Hirschman index (HHI). HHI is a measure of market concentration which is calculated by squaring the market share of each firm competing in a market and then summing the resulting numbers. It can range from close to zero to 10,000. The U.S. Department of Justice uses the HHI for evaluating potential merger issues (Department of Justice, 2018).
Probability of firms exiting the market if they own less than 6 wells
The second analysis is to calculate the probability firms with less than 6 wells go out of business in both states after the regulation was introduced in ND. The probability for both states, ND and WY, was calculated by finding out the total number of wells per operator before and after the regulation was introduced in ND in 2015. This provides a difference-in-difference setup which will ensure that both temporal and spatial general trends are controlled for (Angrist and Pischke, 2009). To compare between small and large operators’ probability for operators with less than 6 wells and more than 5 wells was calculated in both the states to make sure no other market condition was causing the operators to go out of the market.
Graphical analysis depicting concentration of firms in specific areas
Using the features in DrillingInfo to map the gas pipelines on top of the well locations, we were able to find out the change in the concentration of the wells near and away from the available infrastructure of pipelines.

- Figure 1: Representation of wells in ND before and after policy implementation
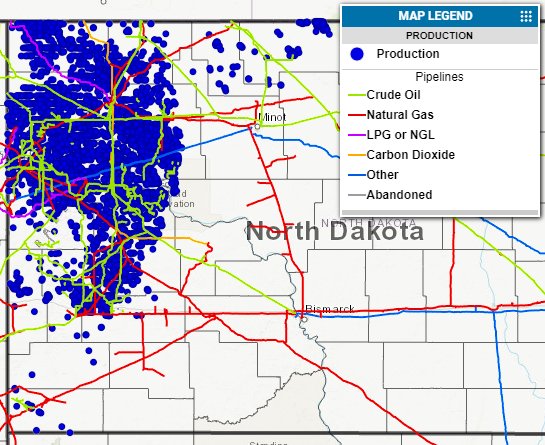
Figure 2: Representation of wells in WY before and after policy implementation
Conclusions
From the HHI index calculation, it was seen that market concentration in ND was increasing by 1% after the regulation while in WY it increased by 3%. While the HHI is a useful metric for determining market share, it might not capture whether smaller firms are being disproportionately impacted by the flaring regulation. To get a better understanding of this specific issue, the next analysis was performed.
From the probability calculation, it was observed that operators with less than 6 wells were 10% more likely to stop drilling wells in the state in ND relative to WY after the flaring regulations went into effect in ND.
Small operators were 82% more likely to stop drilling wells in the state in ND compared to large operators after the flaring policy went into effect. Similar calculation in WY showed that the small operators were 47% more likely to go out of business than large operators. The increase in probability by almost twice may be an indicator that the policy introduced is causing the smaller operators to go out of business. The probability of bigger operators leaving the industry in the state was 5% in ND compared to 29% in WY. This shows that the policy and the other market conditions in ND are favoring the bigger operators.
The concentration maps generated from the dataset shows the concentration of firms in certain regions dominated by availability of gas pipelines in ND while WY map shows no change in location of wells by operators.
From these three analyses, there is evidence that the gas flaring policy introduced in ND, although to reduce environmental pollution in the state, could have been disadvantageous to the smaller firms and favored the bigger firms with more wells.
Utkarsh Srivastava
Masters-level petroleum engineer with minors in Energy Economics and Computer Science with a concentration in data analytics and Machine learning. Proficient in Python, MATLAB, R, VBA, and SQL. Wide range of experience including reservoir modeling, hydraulic fracture modeling, rate transient analysis, decline curve analysis, and reserves evaluation.
Recent Comments