
By Daniel Croce
Background
When assessing the revenue growth opportunities for a company, the first and most crucial activity to perform is the market segmentation. This defines and quantifies the growth opportunities, as same as determine the profit and success chances. Whether it is launching a new product or addressing opportunities of an existing one, the 4 P’s (price, product, placement and promotion) are evaluated to define the attributes of the products offered, price ranges or advertising messages. For this step, every bit of data matters.
To perform a product segmentation, the analysis can be done on the technical or the perceived attributes of the items in the market. This gives a perspective about how the offer is organized in terms of the purchase drivers, and where the opportunities for sales growth are. In this article, we show the results of a market segmentation done upon the attributes of a sample data of the motorcycles offered in the US market.
Objective
The objective is to identify where the opportunities lie for offer improvements or new developments, in the motorcycle market. All the data analysis presented in this article, was done using SAS, specifically SAS university Edition (SAS.com).
Analysis process
Given the different formats followed by the market data providing companies, the data sets were cleaned and rearranged upon string reading scripts. Over 3500 models (original models and buyer customizations) were analyzed, choosing the technical qualities such as horsepower, rake angle, seat height, torque, engine size, as the market bounding attributes. Once reorganized, the data was simplified considering only the leading models in sales.
After cleaning and organizing the variables, it was selected the market-bounding attributes. For each set, the variables chosen were: Wet Weight, Seat Height, Wheel Base, Rake and Trail for the first; while, for the second, Top HP, Max Torque, Quarter Mile Time and Top Speed (for the quarter mile). Using the results from the cluster analysis, perceptual maps were built to identify the open spaces for new product launches.
Results
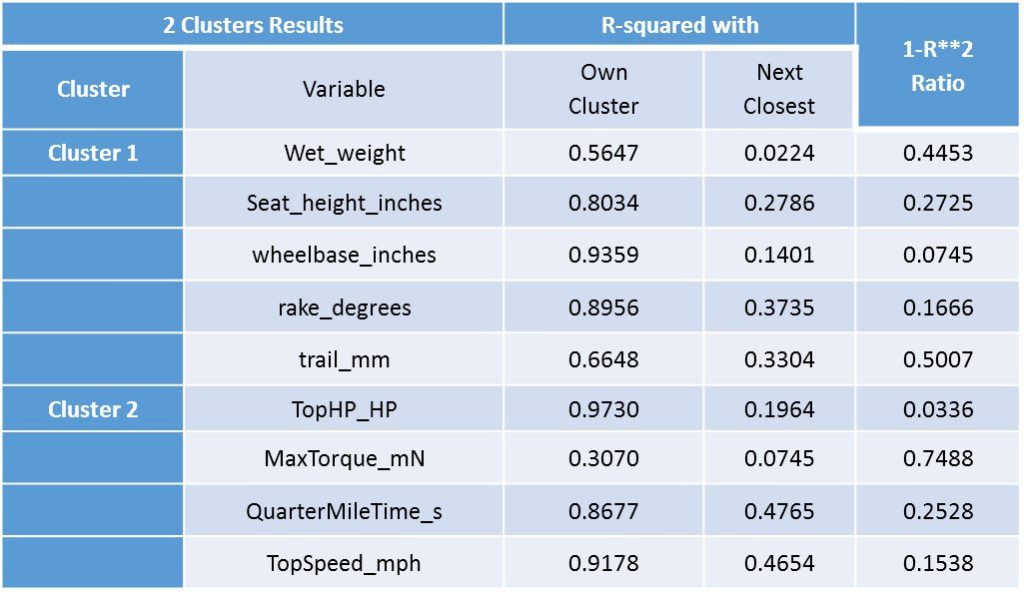
According to the cluster analysis, the product offer in the bike market was segmented into two main clusters, as indicated on the Figure 1: one defined by ergonomics and handling, and another one by racing performance attributes. As shown on the Table 1, the variables defining the first group were wet weight, seat height, wheel base, rake and trail; while those defining the second group are top HP, max torque, quarter mile time and top speed.

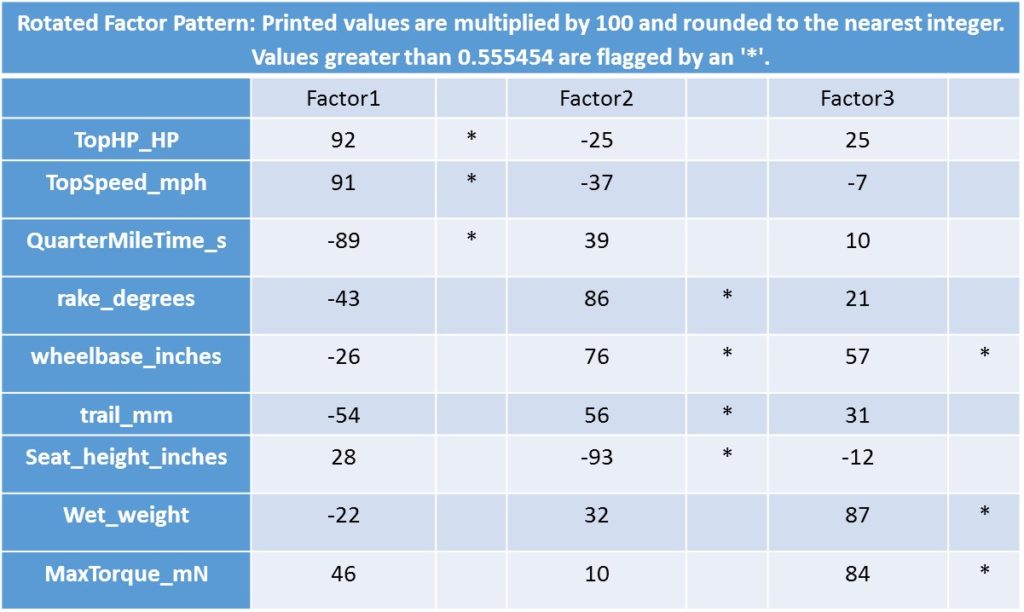
To build the perceptual maps, an iterative approach was followed to define the type of factors and the total number of them. The first attempt for the number of factors was two, considering the results of the clustering process. The optimum “Ward analysis” resulted in three factors for the perceptual maps: Power, Comfort/Maneuverability, and Muscle. Each of the defining variables for each factor are shown on the Table 2.
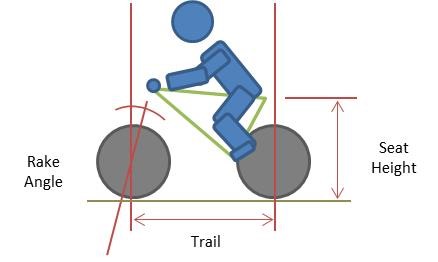
The first factor, labeled “Power” was defined by racing performance variables, where top speed and therefore low time on the quarter mile were the main variables. The second factor, named “Comfort and Maneuverability” resulted from the called “bike rider triangle”, presented on the Figure 2, where inclination of the back, height of the seat and dimensions of the bike, determine the comfort of the rider. The third factor was defined as Muscle, as it included torque and wet weight of the bike, which not necessarily translates into speed, but into acceleration and initial response.
Power bikes tend to present high seat heights and short rake angles, requiring the driver to adopt a more horizontal and aerodynamic profile while riding. When stopped, the legs tend to be extended, as the seat height is higher than in cruiser bikes. A typical example of this type of bike is the Honda CBR. On the other end, there are the cruiser bikes, which stand on the opposite side on both indicators of comfort, allowing a more “laid back” position for driving. The back of the driver tends to be straight, requiring the arms to be extended. The rake angle is larger than on a performance bike, while the seat height is lower.
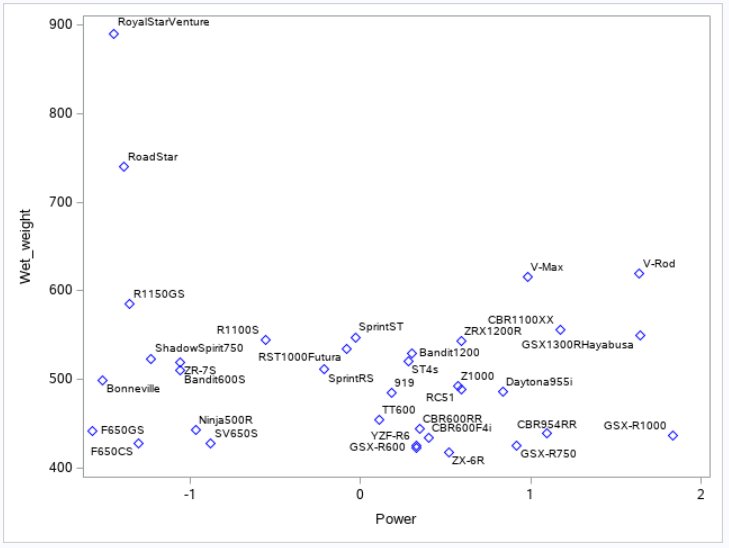
The perceptual maps built from the three factors, show a clear orientation of the market offer towards performance (power) leaving the driving comfort on a second plane (see Figure 3). The market presents a broad offer in terms of power bikes (above the zero value for the “power” vector), going from the Super-bikes (Hayabusa and CBR954RR, 156 HP) to Enduro bikes (R1150GS, 80 HP) and Street-racing bikes (Ninja500R, 50 HP). Out of the main largest selling, about 20% (out of 35) are oriented towards comfort and maneuverability, while the rest stood clearly away from this factor, as indicated on the Figure 3.
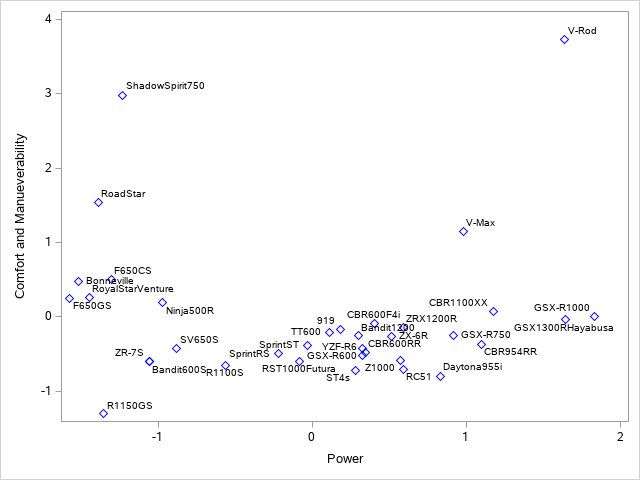
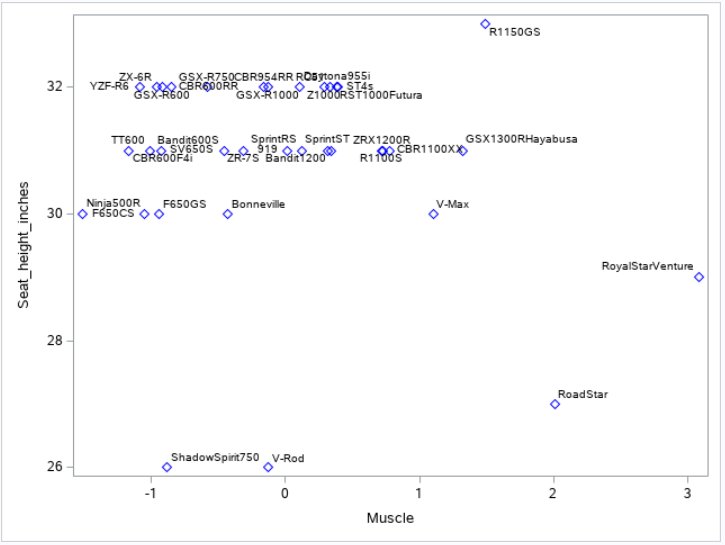
The offer of muscle bikes is a little bit smaller than that of the Power bikes. Within the muscle bikes, there is a lack of more comfortable and maneuverable options. Even when more saturated, the segment of power (or muscle bikes), presents limited options for novice drivers (such as the Shadow Spirit and the V-Rod). In general terms, the broad of the population analyzed (nearly 80%), presented high seat heights (between 30 and 32 inches) and low rake degrees (22.5 to 27.5). This implies a not so comfortable position for riding, matching the distribution of the Figure 4.

As indicated on the Figures 5 through Figure 7, there exists an opportunity for both the cruising and power bikes, to improve the ergonomic attributes. Options of lower wet weight, lower seat and larger rake angle, should improve the maneuverability of the bikes, and increase the offer for those looking for either performance or cruising bikes.

Conclusions
The lack of comfort-oriented bikes in the motorcycle market, represent a clear opportunity for new product developments. The market lacks of bikes with lower seat heights and bike weights, as same as larger rake angles that improve the ergonomics and comfort of the drivers, as same as maneuverability. It is important to mention that, even when bikes deliver on the growing consumer trend of more energy-efficient transportations, none of the data sets provided by the market data providers, included the mpg (miles per gallon) data of the bikes. It would be interesting to add this variable for further studies.
Daniel Croce
MSc, PhD student, Colorado School of Mines
“ Mechanical engineer specialized in fluid flow and energy conversion in the oil and gas industry. Supported by grad studies in the top petroleum schools in the US, wireline experience and a deep commercial background from top international consumer goods companies. Currently performing as both Research and Teaching Assistant in the department of Petroleum Engineering of Colorado School Mines. Skilled in data analysis, CFD, project management and situation analysis. ”
Recent Comments