
By Elii Skeans
Background
Several months ago I was interested in purchasing a new car. Specifically, I wanted to buy a Jeep for off-roading in the summer. I was more interested in buying a used Jeep with some modifications (lift kit, larger tires, winch, etc.). Jeeps are very popular in Colorado and as a result the market for them is high volume with quick turnaround. This makes it hard to analyze all of the options on the market in a time-effective way.
I was in no hurry to buy a car and wanted to make sure that when I bought it I was getting a good deal. It can be pretty hard to compare value across Jeeps with all kinds of different features and modifications; there is no clear market value like new cars have. To do this I needed to think of some way to automate a daily search which identifies features I value and presents them with easily digestible graphs and charts. This way I would save countless hours of scrolling through ads and prevent myself from making a brash decision because I was fed up with the search.
Automating the Search
All of my future potential Jeeps are listed on the internet and the posts are changing daily due to the high volume of sales. I needed to automate a search, extract data from the search results, store the data, run analytics, and then output useful graphs.
Identifying Features
First, I needed to know what information I wanted to search for and collect. The following parameters are what I chose:
- Miles driven
- Model Year
- Make/Model
- Location
- Date Posted
- Price (<$20,000)
Scraping
I like to buy cars from Craigslist.org, so this was the website I needed my code to search. I knew that there were multiple web scraping tools available in the wonderful and labyrinth-like world of Python packages. I decided to use Scrapy which is self-described as “An open source and collaborative framework for extracting the data you need from websites. In a fast, simple, yet extensible way.”

When you search on Craiglist for something you can examine how the url changes for each search page and notice that it is a regular expression (meaning it follows a pattern). Recognizing this was the key to building the web-crawling ‘spider’. The basic tasks my spider accomplished were:
- Search ‘Jeep’ on craigslist at a 100 mile radius around Denver
- Extract the title, price, mileage, odometer, year, and make from the listing
- Output the results to a file
On a Craigslist search page there are tiles for each posting. The spider had to ‘crawl’ across each one of them to get the data I wanted. Luckily each add is labeled with regular html tags which can be searched. For example, the price is located at xpath: '///span[@class="result-price"]/text()'. Each of my variables has its own common tag which I can search for and output sequentially to a text document. Not being a web developer can make this part of the code pretty tricky, but if you are interested in seeing what I am talking about, go to any website and right-click and choose ‘Inspect Element’. If you hover around in the html code you can find the part of the webpage you are interested in, then you can right-click again to copy the xpath.
Data Analysis
Now we have this text file built as a table with the output of the days search for Jeeps. Next, I have a separate code which I run in Jupyter Notebook to analyze the data. The main libraries used for this task are pandas and matplotlib. Pandas is an absolutely essential data science library for python and matplotlib is a robust visualization package for making graphs.
The most basic analysis I ran was price by year shown in Figure 1.

This chart tells me a number of things even though it is pretty basic. (1) There are more newer Jeeps than older ones for sale. This is expected since cars tend to die after 20-30 years or so of use. (2) The oldest Jeeps are the most expensive. This is also logical given that a 1960 Jeep must have had extensive renovations and may be a collectors item as well.
There are several Jeep models to choose from; Wrangler, Cherokee, Commander, Liberty, etc. I was mostly interested in finding either a Cherokee or a Wrangler so I split the dataset into three categories:
- Wrangler
- Cherokee
- Other
Plotting the same graph for each category gives further insight: Figure 2.

Another important parameter to consider was the odometer reading for each car. To plot this I decided to segment the ads into three odometer ranges:
- 0-50k miles
- 50-100k miles
- 100-150k miles
I wasn’t interested in cars with more than 150 thousand miles on the engine so this worked well. Plotting Wrangler and Cherokee separately for price by year and coloring by odometer range gave Figure 3. From this we see that:
• Jeeps with less miles are newer
• Most have over 100k miles
• There are few Wranglers under $20k with less than 100k miles
• Cherokees with less than 100k miles tend to be newer than Wranglers with the same mileage

It is easier to analyze the data all on one graph, so I decided to plot a 3D scatter chart for each odometer range by price by year and colored by model. In Figure 4 we see the output for this idea. From this we see that the quantity of Jeeps decreases with less mileage and that there is an inverse relationship between price and mileage. My ideal purchase would be a Wrangler with less than 100k miles and less than $15,000. With this in mind, my target is the middle of the far right cluster for potential purchases.


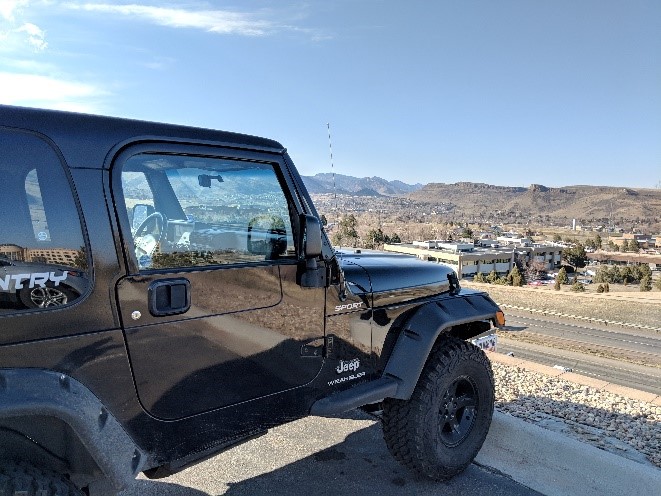
Results and Values
Running my web-crawler and analyzing the graphs led me to my final decision (Figure 5) after about 3 months. I’ve been more than pleased with my final purchase and had a lot of fun building my python skills while solving a real life problem.
Elii Skeans
Recent Graduate in Petroleum Engineering
“Specializing in reservoir simulation for enhanced oil recovery (EOR), I have also taken interest in data analytics. At the company I work for, Surtek, we deal mostly with national oil companies. These are some of the biggest companies in the world and with big companies come big data. Data science tools like Python and R have been phenomenal for me in my position as a reservoir engineer and have helped me to bring extra value to our customers as well as stand out in my company.”
Recent Comments