
by Zachary Zody
The US Department of Energy (DOE) is interested in exploring ways to spur innovation for alternative sources of fuel and energy. One type of source the public is generally unaware of are known as enhanced geothermal systems (EGS). These systems, unlike conventional geothermal systems, are manmade and have recently become more feasible because of technical advances in the oil and gas industry. An EGS can be thought of as a giant radiator underground. Hot rock with no pores or cracks is drilled into and stimulated – the rock is put under high pressure in order to break pathways through it to a second well. Water is then circulated through these two holes and brings the heat from underground back to the surface.
The DOE put on a data visualization competition with one goal – how creatively can people choose a location for an EGS given a ton of data and almost no constraints or prior knowledge required. A suite of visualizations was created for this competition and can be viewed here. The data came from the Utah FORGE sight, an EGS research center ran by the DOE and University of Utah.
A pair of wells was placed based on one main idea – deep rock needed to be avoided because, according to the data, this made drilling almost impossible, exposed underground pockets of dangerous hydrogen sulfide, and many preexisting fractures would allow water to leak out of the system. A few different techniques were used to tell a story and show the final proposed well locations.

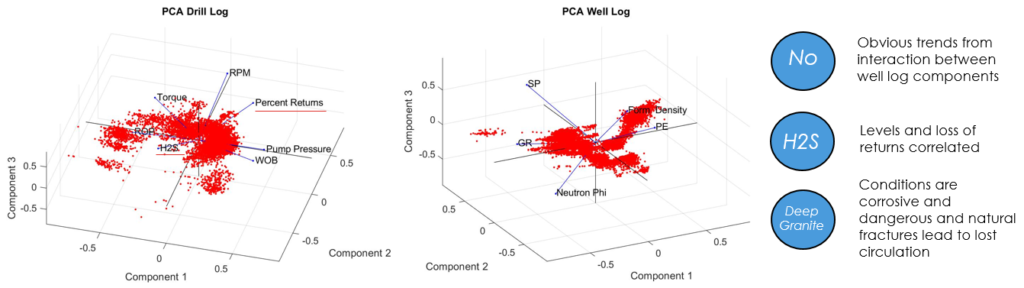
Next a principal component analysis was conducted on the logs in order to look at the data from a different perspective (Figure 1). This type of analysis determines how many components are needed to account for all the variance in a given set of data (Figure 2).

Components can be thought of as combinations of variables – for example, in the case of the volume of a brick, length, width, and height would all be variables making up a principal component. This analysis confirmed what the previous analysis had (Figure 3).
The last thing required was to justify the placement of the EGS in the given region. Contour maps were created in order to find the right combination of factors for location (Figure 4).
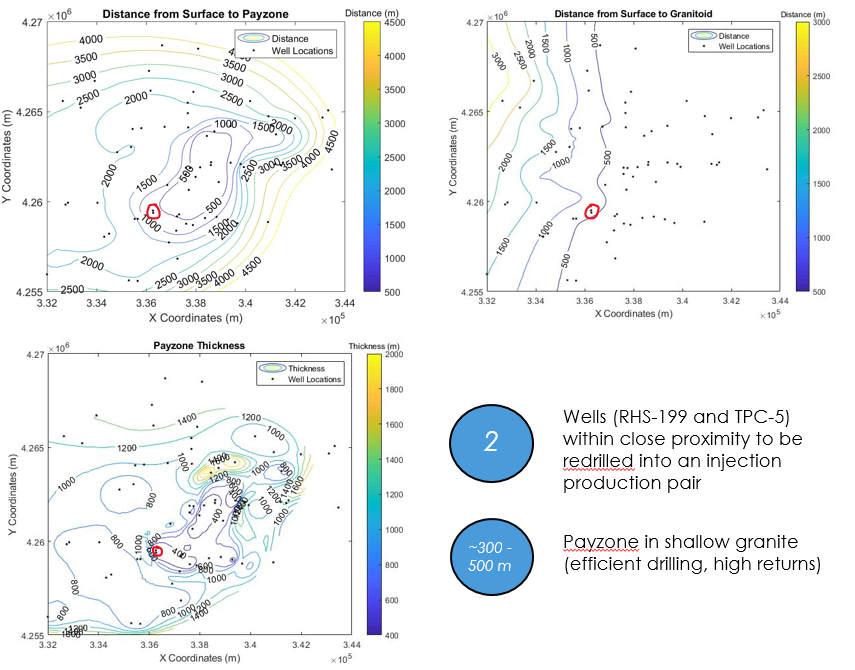
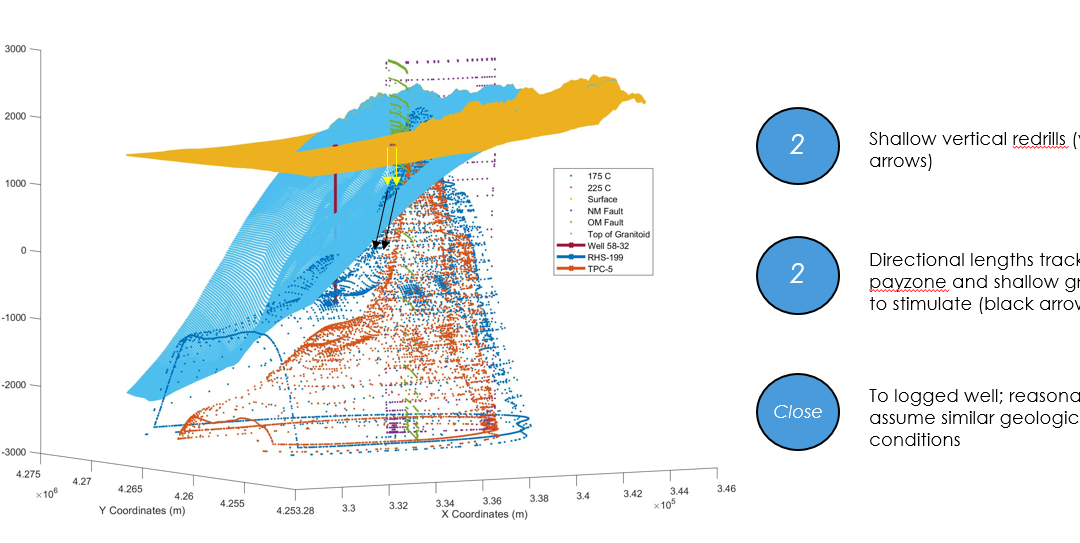
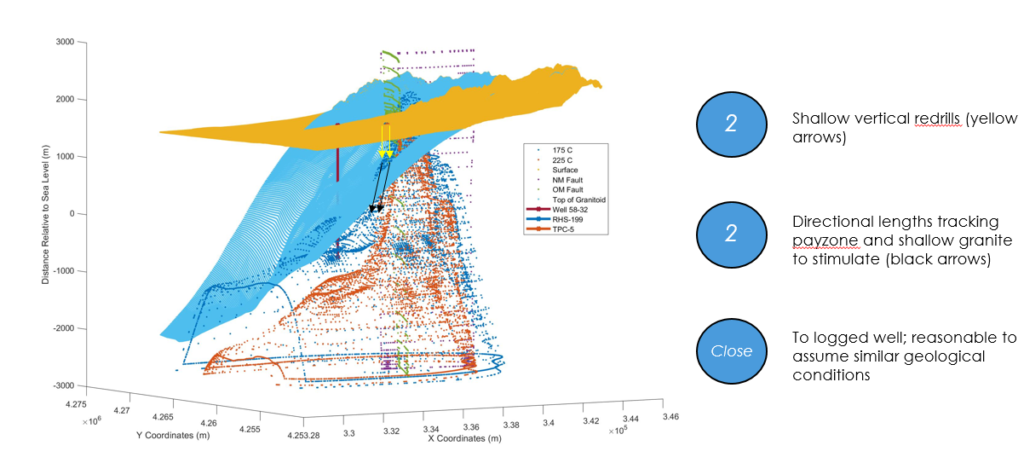
Things considered were depth to necessary temperature, likelihood of the geology being the same as the already logged well, and existence of abandoned wells (not having to redrill the entire system saves money). Finally, a 3D map of the region was created in order to display everything in space (Figure 5).
“I am interested in applications of drilling, geomechanics, data analysis, and robotics to extreme conditions and interdisciplinary approaches to subsurface problem solving. This includes operations in unconventional, hard rock, sub sea, and extraterrestrial environments. I have a strong background in manufacturing and lean techniques. I have applied computer science and statistical techniques in order to combine engineering knowledge, data, and machine learning for effective results. Leadership positions I’ve occupied include high school coach, project manager, technical community representative, and amateur varsity athlete. I am currently looking for opportunities to apply my experience in an impactful way.”
Zachary Zody
MS, Petroleum Engineering
Recent Comments